New local temporary tablespace in 12.2 defaults to SYSTEM for some users after upgrade

2018-03-22 update: Mike Dietrich blogged on this, with a kind tip o’ the hat. Also updated bug and planned fix info.

Note: big thanks to the invaluable Mike Dietrich for the help with this one.  And a dozen other upgrade issues that we learned about from his blog.  As well as to my awesome colleague Tom Nicholson who identified the issue.

While upgrading databases to 12.2.0.1, we ran into an issue with the new feature called Local Temporary Tablespaces. While a good concept, it has some problems with how it sets itself for users during upgrade, and it seems as if everyone should be checking this post-upgrade and fixing it if necessary.

To quote the Oracle doc on Local Temporary Tablespaces: “Starting with Oracle Database 12c Release 2 (12.2), local temporary tablespaces are available. A local temporary tablespace stores separate, non-shared temp files for every database instance. A local temporary tablespace is used only for spilling temporary results of SQL statements, such as queries that involve sorts, hash aggregations, and joins. These results are only accessible within an instance.”  Also see the Concepts doc version of the explanation. You do not have to create this tablespace on shared disk, even with RAC, as it is intended to be local instance only.

There is a new column in DBA_USERS, LOCAL_TEMP_TABLESPACE, that shows the default local temporary tablespace.  This functions just like the default temporary tablespace, in that it’s a default.  There is also a new database-wide parameter, again just like the default temporary tablespace, which defines what to assign a user if you don’t specify it in the create user command.  See below for some poking around with the new database property.

Now for the problem … while testing some existing code that uses dbms_metadata.get_ddl to generate user create statements, my colleague Tom saw it was now generating a second ALTER for each CREATE USER, which set the default local temporary tablespace.  And then he noticed that for a subset of the users, the alter was trying to set local temp as SYSTEM, which would fail with ORA-12911: permanent tablespace cannot be temporary tablespace.  After some research on the new feature and looking at LOCAL_TEMP_TABLESPACE in dba_users we saw that a significant portion our existing users had their default local temporary tablespace set to the SYSTEM tablespace after upgrade.  All users should have been left NULL for local_temp_tablespace, as is the expected behavior, which would cause them to default to using their default temporary tablespace just as they would have in 12.1.  But that’s not what happened.

select    local_temporary_tablespace  -- 12.2 only
        , temporary_tablespace
        , count(*)
FROM dba_users
group by local_temporary_tablespace, temporary_tablespace
order by 1;

LOCAL_TEMP_TABLESPACE TEMPORARY_TABLESPACE   COUNT(*)
--------------------- -------------------- ----------
SYSTEM                TEMP                         49
TEMP                  TEMP                         12
                      TEMP                         66

Out of 127 users, 66 had the expected behavior of being set to NULL, and therefore defaulting to their default TEMP tablespace. 12 were set to TEMP. And 49 were set to SYSTEM. Which, of course, is not a TEMP tablespace at all.

After some conversation with Mike Dietrich, he noticed that the SPARE9 field found in sys.user$ was set to 0 for all of users that were assigned the SYSTEM tablespace as their local temporary tablespace. It is consistent across multiple different databases that we have upgraded. This seems to be the thing that triggers the incorrect assignment. We opened an SR and found out that there is a (non-visible) bug open with Development on this, Bug 23715518. There is no fix planned at the moment. [Through Mike Dietrich’s blog, learned the full bug name: BUG 23715518 – APPSST12201::SYSTEM TABLESPACE IS MARKED AS LOCAL_TEMP_TABLESPACE AFTER UPGRADE and that it will be fixed in Oracle Database 18c.] The impact of this is not clear but the idea of some types of temp operations (sorts, hash aggregations, and joins) occurring in the SYSTEM tablespace doesn’t seem like a good thing … if this indeed happens, not confirmed by testing at this time.

We decided for now to run a script to change the local temp to match the user’s temp and Oracle agreed with this workaround. It’s a pretty trivial piece of SQL to generate the required script but here it is for convenience …

select 'alter user '||username||' LOCAL TEMPORARY TABLESPACE '||TEMPORARY_TABLESPACE||';'
from dba_users where username not in ('XS$NULL'); 

You could also choose to only do this for users who have their local temp set to SYSTEM and leave the rest alone.  We opted for consistency.

Unrelated to the problem, here’s little bit of futzing with the overall database default for local temp tablespace.

-- the default is null after 12.2 upgrade

> SELECT PROPERTY_NAME, PROPERTY_VALUE FROM DATABASE_PROPERTIES 
WHERE PROPERTY_NAME like 'DEFAULT_%_TABLESPACE';

PROPERTY_NAME                            PROPERTY_VALUE
---------------------------------------- ----------------------------------------
DEFAULT_PERMANENT_TABLESPACE             USERS
DEFAULT_TEMP_TABLESPACE                  TEMP

-- you can't just set it to TEMP if it's currently null and 
-- TEMP is your default, since it defaults to that anyway

> ALTER DATABASE DEFAULT LOCAL TEMPORARY TABLESPACE TEMP;
ALTER DATABASE DEFAULT LOCAL TEMPORARY TABLESPACE TEMP
*
ERROR at line 1:
ORA-12907: tablespace TEMP is already the default temporary tablespace

-- there's no reason to do this, but it's interesting to try ...
-- we happen to have second temporary tablespace in this database

> ALTER DATABASE DEFAULT LOCAL TEMPORARY TABLESPACE PSTEMP;

Database altered.

-- and now it will let you set it to TEMP

> ALTER DATABASE DEFAULT LOCAL TEMPORARY TABLESPACE TEMP;

Database altered.

> SELECT PROPERTY_NAME, PROPERTY_VALUE FROM DATABASE_PROPERTIES 
WHERE PROPERTY_NAME like 'DEFAULT_%_TABLESPACE';

PROPERTY_NAME                            PROPERTY_VALUE
---------------------------------------- ----------------------------------------
DEFAULT_LOCAL_TEMP_TABLESPACE            TEMP
DEFAULT_PERMANENT_TABLESPACE             USERS
DEFAULT_TEMP_TABLESPACE                  TEMP

Oracle back-port patches for Adaptive performance issues released for 12.1 (dynamic stats)

Previously I wrote about performance issues with 12.1 Adaptive features, specifically the large number of dynamic statistics checks, usually triggered by the existence of SQL Plan Directives.  See previous articles: here (performance impact to the result cache and the fix described were slightly different than the typical experience, but the root cause was the dynamic stats queries being run) and here (turning off adaptive features results in drastic performance increases).  After that post I also was able to verify in repeatable testing that only turning off the hidden parameter “_optimizer_dsdir_usage_control”, which disables the optimizer usage of dynamic statistics (sampling), had the same impact as turning off all Adaptive features with OPTIMIZER_ADAPTIVE_FEATURES.

Oracle more recently came out and said that the way Adaptive features are enabled has changed in 12.2, and it’s clear that this is an admission that dynamic stats (triggered by SPD) were being overused. Christian Antognini explains the changes well here.  In short,  OPTIMIZER_ADAPTIVE_FEATURES goes away and is replaced by are two new parameters, OPTIMIZER_ADAPTIVE_PLANS and OPTIMIZER_ADAPTIVE_STATISTICS.  The latter controls the problematic adaptive use of dynamic stats and it is DISABLED by default.  <cue choirs of happy music and the like>

Just a few days ago, Mike Dietrich posted  about this change and posted links to the back-ported patches for 12.1.  Oracle’s recommended approach is now to install these patches on any 12.1 upgrade or install, rather than waiting for 12.2.  There’s a MOS Note on the subject, the link in his blog doesn’t seem to work, but you can find it here: Recommendations for Adaptive Features in Oracle Database 12c Release 1 (12.1) (Doc ID 2187449.1).  Use the MOS note for definitive patch links since things could change, and I’m direct linking to the patches I’d need, so YMMV. However, for convenience the patches are 22652097 and 21171382 (which has a confusing name and is older, but links to one of the bugs that we want to see resolved). The one we really want that changes the parameters and disables excessive dynamic stats is 22652097 and it requires the July patch set (12.1.0.2.160719).

We just finished a patching round … guess we’ll be starting the next one earlier than usual.

Edit Fall 2017: Captured a nice graph that shows a fairly typical Peoplesoft job graphed by job runtime before and after disabling the the hidden parameter “_optimizer_dsdir_usage_control”.  (From Peoplesoft job runtime data, not database metrics.) Adding it here. These are queries with literals that can’t be changed … for reasons.  Looking at database AWR metrics also shows queries with the same force_matching_signature using the same plans with roughly the same data sizes running faster and with less logical IO.

Screen Shot 2017-11-15 at 1.44.14 PM


Peoplesoft and 12c Adaptive Features

2016-11-29 EDIT: Oracle has announced that in 12.2 the features that drove this overuse of the result cache (dynamic stats triggered by SPDs) will default to off, and provided patches to apply to 12.1 as well.  More info here.

I had been collecting examples and mentally writing something about this but the king of Peoplesoft DBAs, David Kurtz, beat me to it.  So I’ll just link to his analysis: Peoplesoft on Oracle 12c.  Read on for some of my own experience tuning around the issues with 12c Adaptive Features.  Apologies that it isn’t complete or full of examples, I wanted to at least get something out here before more months pass me by.  I may improve it over time.  Also, the experiences that led to this post were on 12.1.0.2.0.  We have patched to 160119, the January bundle patch, but there hasn’t been enough time to assess if any of the fixes to SQL Plan Management and Adaptive features apply to this situation.

The short story is that Peoplesoft has a lot of trouble with the 12c adaptive features.  Peoplesoft still has a lot of queries that do not use binds.  Especially with Peoplesoft jobs that run thousands of these queries that are normally < 1 second, there can be relatively massive increases in runtime when you move to 12c.  If you look at trace files (10046 and 10053), you see that what is happening is that it is spending a ton of time in the parse phase, doing “test” queries.  This is of course poor application design, but it is a vendor app and it certainly isn’t the only one like it.

Unfortunately the issues with applications that are not perfectly designed for Oracle were not apparent until we spent some quality time with our Peoplesoft databases running on 12c in production.  So at this point it would take a pretty large performance testing effort to turn off adaptive features at the database level.  So far, I have been working with individual performance issues by:

  • Having the developers add session variable statements to turn off adaptive features at the beginning of the job;
  • If that’s not possible, or we only want to fix one query, having them add an OPT_PARAM(‘OPTIMIZER_ADAPTIVE_FEATURES’,’false’) hint;
  • If they can’t/won’t change the code (delivered code, for instance) then I create a one-hint SQL Profile with force matching on.

I’ve seen a number of similar-but-different issues with performance and 12c adaptive features, but one recurring pattern that is resolvable in the same way each time goes as follows.

  • Cursor pin s wait on x waits
  • Also library cache pin
  • Spending inordinate time in parse

In 11g, the “fix prod fast” solution for an execution plan gone rogue was to look at the history of various plans, find a good one, and create a SQL Plan Baseline (we’ll ignore differing plans for differing binds for now for the sake of brevity).  Then you can go back and take some time to look at stats.  One of the most annoying things about 12c Adaptive Features is that SQL Plan Directives cause the Optimizer to ignore your SQL Plan Baselines.  It thinks it knows better, or at least it wants to try and find out.  More aspects of this particular situation:

  • SQL Plan Baseline(s) are ignored/not used, even if Accepted, even if Fixed (maddening).  Either a baseline you create to try to fix the problem, or one that was already there – same result.  You can see them being considered and discarded in an Optimizer trace.  Even if the plan was used by the same query moments ago, the Optimizer says they fail to validate as workable plans.
  • There are tons of SQL Plan Baselines, sometimes 100+.
  • Often, at least one of the tables involved in the query has an inordinate number of SQL Plan Directives, even after running stats.

To fix this situation I have taken the following steps:

  • Created SQL Profile disabling 12c Adaptive Features (thanks to Kerry Osborne for his single-hint sql profile script) … see hint above.
  • Deleted all SQL Baselines.  Flush the individual statement from cache if necessary.
  • At this point, parse related waits dropped off.
  • The query was now using a new plan but it was not a great plan, so it was still somewhat slow (but not waiting on parse / pin S / library cache etc).
  • Ran stats on all tables involved, a new plan was derived by the Optimizer. (Note: stats were not stale and had also been run manually per-table beforehand to attempt a fix.)
  • Created new baseline with best plan.

From that point on, performance was excellent, parse time was minimal, and the plan was stable.

Bug in tablespace size/usage monitoring in 12.1.0.2 OEM (DBA_TABLESPACE_USAGE_METRICS)

Despite rarely posting these days, this one is worth trying to get the word out.  We just ran across a 12.1.0.2 bug which is not fixed in the January or April bundle patches/PSUs.  It is also not mentioned in the 12c “you should install these one-off patches” page.  Yet it has the ability to take down your production environment.

The view DBA_TABLESPACE_USAGE_METRICS is used by OEM to drive its alerts on tablespace storage.  It turns out that due to a bug in the code behind the view, it leaves out a number of tablespaces entirely.  You can easily see the problem by comparing DBA_TABLESPACES and DBA_TABLESPACE_USAGE_METRICS.  This means that if any of the missing tablespaces runs out of space (hits the max autoextend) you won’t get any of your percentage-free alerts before it does.  We found anywhere from one to over 70 missing tablespaces, depending on the database.  Every database was missing at least one tablespace from this view.

You can easily see the problem by comparing DBA_TABLESPACES and DBA_TABLESPACE_USAGE_METRICS:

select tablespace_name from dba_tablespaces 
where tablespace_name not in (
    select tablespace_name from DBA_TABLESPACE_USAGE_METRICS
);

We thought we were smart by having another backup monitor running from cron, in case OEM missed sending a notification or we missed it.  Except we used the same view in our monitor, so it misses these tablespaces as well.  Just goes to show that it’s always tough to judge how paranoid to get when trying to eliminate dependencies in redundant systems.

I’m pretty miffed that this has not been deemed important enough issue to be included in a bundle patch.  It’s a big deal, but apparently Oracle doesn’t think so.  If they’d even just referenced it on their page about important one-offs to apply to 12c, we would have already had it in production as of our most recent patching round.

Edit: Oracle Support recommended the 12.1.0.2.4 version of the patch to apply on our 12.1.0.2.160119 Oracle home, and it worked, the missing regular tablespaces now show up in the view.  However, the Oracle doc on this says that “DBA_TABLESPACE_USAGE_METRICS describes tablespace usage metrics for all types of tablespaces, including permanent, temporary, and undo tablespaces.”

After applying the patch, all of the normal tablespaces are now included in the view:

select distinct tablespace_name from dba_data_files minus select tablespace_name from dba_tablespace_usage_metrics;

no rows selected

HOWEVER the TEMP tablespaces are still missing – is this a new bug?  Updated SR to find out, will update here when I know.

select distinct tablespace_name from dba_temp_files minus select tablespace_name from dba_tablespace_usage_metrics;

TABLESPACE_NAME
——————
PSGTT01
PSTEMP


Latch free waits, Dynamic Statistics, and the Result Cache

2016-11-29 EDIT: Oracle has announced that in 12.2 the features that drove this overuse of the result cache (dynamic stats triggered by SPDs) will default to off, and provided patches to apply to 12.1 as well.  More info here.  Also, some investigation by Mauro Pagano around the impact of the new OPTIMIZER_ADAPTIVE_STATISTICS parameter turned up an interesting minor fix related to this post: the result cache hint is no longer used in dynamic stats queries. So once you apply the patches/upgrade to 12.2, it should resolve the issue discussed in this post even if you turn SPD-triggered dynamic statistics back on.

2015-06-03 EDIT: looks like earlier in May Oracle published a brief doc based on my ticket(had discussed the need for a doc with engineer): High “Latch Free” Waits with Contention on ‘Result Cache: RC Latch’ when RESULT_CACHE_MODE = MANUAL on Oracle 12c (Doc ID 2002089.1)

2015-05-27 EDIT: Some great discussion in the comments, and based on that I added some info at the end.  So if you’re doing the TL;DR thing, don’t skip the very end.


Recently migrated Peoplesoft Campus Solutions database from 11.2.0.3 Solaris non-RAC non-ASM to 12.1.0.2 Linux ASM RAC (yes really, all at once). This is a mixed workload database, OLTP and Peoplesoft batch jobs. Seeing a lot of “latch free” waits during job runs and more than you would expect even during low times when no jobs are running. This is odd, usually there is something after “latch free: ???” since 10g and also we have never seen latching issues before on 11g with the same workload. It is also clear that it is having a significant performance impact because certain jobs are taking many times longer to run when these waits are high. The jobs (like many delivered peoplesoft jobs) cause a fair amount of blocking which is acceptable to the business side when they last 11 minutes but not when they last an hour — so much blocking occurs with the job having latch free waits at the root that eventually there are multiple-participant deadlocks and the job fails. And of course regular users are being blocked for a long time so web usage is heavily impacted.

AWR showed that the latch free wait was actually 100% “Result Cache: RC Latch.”

&amp;gt; select name, gets, misses, sleeps, immediate_gets, wait_time/1000 wait_time_ms
     from v$latch
     where name like 'Result Cache%'
/
NAME                                 GETS     MISSES     SLEEPS IMMEDIATE_GETS WAIT_TIME_MS
------------------------------ ---------- ---------- ---------- -------------- ------------
Result Cache: RC Latch           97101269    1106885     995211              0    128375216
Result Cache: SO Latch             124798         15          0              0            0
Result Cache: MB Latch                 93          0          0              0            0

That’s ugly. Ok, so we’re having problems latching on the result cache. The question is, why are we using the result cache at all?

&amp;gt; show parameter result
NAME                                 TYPE                              VALUE
------------------------------------ --------------------------------- ------------------------------
client_result_cache_lag              big integer                       3000
client_result_cache_size             big integer                       0
result_cache_max_result              integer                           5
result_cache_max_size                big integer                       330304K
result_cache_mode                    string                            MANUAL
result_cache_remote_expiration       integer                           0

result_cache_mode is set to MANUAL so (according to 12c docs) only the results from queries that use the RESULT_CACHE hint should be stored in the result cache.

I verified that none of the user or job queries were using the result_cache hint. A search of gv$sql looking for ‘%result_cache%’ in sql_text was illuminating — 400K (fluctuates) sql statements that contained the result_cache hint. They turned out to all be from dynamic sampling/statistics, as can be determined by the presence of the DS_SVC hint — here’s an example:

2015-04-11/14:30:23                                       a8gdt9zqk2b3m
SELECT /* DS_SVC */ /*+ dynamic_sampling(0) no_sql_tune no_monitoring optimizer_features_enable(default) no_parallel result_cache(snapshot=3600) */ SUM(C1) FROM (SELECT /*+ qb_name("innerQuery") NO_INDEX_FFS( "PS_SSR_TSRSLT_STAT")       */ 1 AS C1 FROM "PS_SSR_TSRSLT_STAT" SAMPLE BLOCK(1.37542, 8) SEED(1
)  "PS_SSR_TSRSLT_STAT" WHERE ("PS_SSR_TSRSLT_STAT"."REPORT_REQUEST_NBR"='003125267') AND ("PS_SSR_TSRSLT_STAT"."STRM"='1137') AND ("PS_SSR_TSRSLT_STAT"."REQUEST_SEQ_NBR"=1) AND ("PS_SSR_TSRSLT_STAT"."REPORT_NUMBER"=1)) innerQuery

There were ZERO queries in gv$sql that used the result_cache hint and were NOT from dynamic sampling.

OK, why are we using dynamic sampling so much, I thought things were at the defaults. I know 12c has a new level of 11 or AUTO which mean “the optimizer will use dynamic statistics to verify cardinality estimates for *all* SQL operators, and it will determine an internal time limit to spend verifying the estimates.” (http://docs.oracle.com/database/121/REFRN/refrn10140.htm#REFRN10140) But I did not set my database to 11/AUTO.

&amp;gt; show parameter optimizer_dynamic_sampling
NAME                                 TYPE                              VALUE
------------------------------------ --------------------------------- ------------------------------
optimizer_dynamic_sampling           integer                           2

optimizer_dynamic_sampling is set to 2. From 12c docs: 2 means “Use dynamic statistics if at least one table in the statement has no statistics. This is the default setting.” So, I picked out lots of tables from the dynamic sampling sql statements and made sure they had stats, re-ran to be sure, and then watched for them to be dynamically sampled again (should not be). Dynamic sampling statements for these tables continued to show up in gv$sql with “LAST_LOAD_TIME” equal to the present time, so dynamic sampling was continuing to run AND store its sampling statements in the result cache.

At this point I requested a full rolling restart of the Peoplesoft application tier to make sure we did not have some persistent “dirty” sessions where something/someone had issued a session-level dynamic sampling hint at level . This would recreate all the sessions. This did not get rid of the issue.

Next step, I decided to test turning off dynamic sampling to prove the theory beyond a doubt. Before I did this, I ran a query that looked at that last 60 seconds of gv$sql LAST_LOAD_TIMEs. There were hundreds of results. I had also run this query on and off for the past hour and it always had lots of results, clearly there was a ton of dynamic sampling going on. Then I ran this:

alter system set optimizer_dynamic_sampling=0 scope=both sid='*';

After a few minutes, the query consistently returned zero rows for the past 60 seconds. This stayed the same until I turned dynamic sampling back on at level 2:

alter system set optimizer_dynamic_sampling=2 scope=both sid='*';

Instantly there were over 1000 dynamic sampling queries in gv$sql with a last_load_time in the past 60 seconds.

This doesn’t make sense based on what the docs say about level 2, but ok, let’s assume *for now that this is a good thing and take a look at the result cache / tune it.

> SET SERVEROUTPUT ON
> EXECUTE DBMS_RESULT_CACHE.MEMORY_REPORT

R e s u l t   C a c h e   M e m o r y   R e p o r t
[Parameters]
Block Size          = 1K bytes
Maximum Cache Size  = 330304K bytes (330304 blocks)
Maximum Result Size = 16515K bytes (16515 blocks)
[Memory]
Total Memory = 339190216 bytes [2.055% of the Shared Pool]

... Fixed Memory = 108416 bytes [0.001% of the Shared Pool]
... Dynamic Memory = 339081800 bytes [2.054% of the Shared Pool]
....... Overhead = 850504 bytes
....... Cache Memory = 330304K bytes (330304 blocks)
........... Unused Memory = 0 blocks
........... Used Memory = 330304 blocks
............... Dependencies = 2 blocks (2 count)
............... Results = 330302 blocks
................... SQL     = 39452 blocks (39452 count)
................... Invalid = 290850 blocks (290850 count)

Ok, that’s completely full / has used its max allowed memory. Perhaps it needs more (and I did find significant CANCELLED requests where the shared pool wanted to GROW and the buffer cache said NO from the time period where these latch free waits were the worst). However, before we assume that let’s see what we can see about the efficiency of the use of the result cache.

&amp;gt; select trunc(to_date(creation_timestamp, 'MM/DD/YYYY HH24:MI:SS'), 'MI') MIN, count(*)
from V$RESULT_CACHE_OBJECTS
where creation_timestamp &amp;gt; sysdate-1/24
group by trunc(to_date(creation_timestamp, 'MM/DD/YYYY HH24:MI:SS'), 'MI')
order by trunc(to_date(creation_timestamp, 'MM/DD/YYYY HH24:MI:SS'), 'MI')
/
...
04/11/2015 15:17:00        212
04/11/2015 15:18:00        188
04/11/2015 15:19:00        213
04/11/2015 15:20:00        168
04/11/2015 15:21:00        109
04/11/2015 15:22:00        199
04/11/2015 15:23:00        194
04/11/2015 15:24:00        153
04/11/2015 15:25:00        149
...

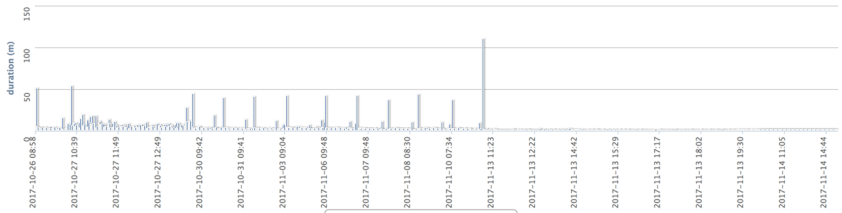
That’s quite a bit of churn for something that’s meant to be reused. Let’s zoom out:

&amp;gt; select trunc(to_date(creation_timestamp, 'MM/DD/YYYY HH24:MI:SS'), 'HH24') HOUR, count(*)
from gV$RESULT_CACHE_OBJECTS
group by trunc(to_date(creation_timestamp, 'MM/DD/YYYY HH24:MI:SS'), 'HH24')
order by trunc(to_date(creation_timestamp, 'MM/DD/YYYY HH24:MI:SS'), 'HH24')
/
HOUR                  COUNT(*)
------------------- ----------
03/27/2015 03:00:00          2
03/28/2015 03:00:00          2
03/30/2015 03:00:00          2
04/10/2015 15:00:00      26881
04/10/2015 16:00:00      88926
04/10/2015 17:00:00      23122
04/10/2015 18:00:00      15636
04/10/2015 19:00:00      20075
04/10/2015 20:00:00       9660
04/10/2015 21:00:00       6549
04/10/2015 22:00:00      14950
04/10/2015 23:00:00      18235
04/11/2015 00:00:00       6855
04/11/2015 01:00:00      17711
04/11/2015 02:00:00       3656
04/11/2015 03:00:00      48318
04/11/2015 04:00:00      54292
04/11/2015 05:00:00     124391
04/11/2015 06:00:00      76643
04/11/2015 07:00:00      81864
04/11/2015 08:00:00      97948
04/11/2015 09:00:00      56916
04/11/2015 10:00:00      22606
04/11/2015 11:00:00      31104
04/11/2015 12:00:00      61384
04/11/2015 13:00:00      21226
04/11/2015 14:00:00      31671
04/11/2015 15:00:00      30287

In a word, wow. With that kind of creation rate, no wonder we are getting waits, since the first run of result cached queries are often slower than without since they have to write to the result cache. We are probably burning through the result cache’s LRU really fast, making it very inefficient — but let’s prove that:

&amp;gt; select count(*) from gv$result_cache_objects;
  COUNT(*)
----------
    990912

Result cache is specific to node. I did verify that the objects were evenly split across nodes (about 300K each).

&amp;gt; SELECT scan_count, count(*)
FROM gv$result_cache_objects
group by scan_count
ORDER BY 2,1
/
SCAN_COUNT   COUNT(*)
---------- ----------
...
         7       6970
         2       8765
         3      64562
         1     161017
         0     725298

Ouch. So of nearly a million objects in the result cache across the cluster, 725K were never used (scanned). I ran this over time a few times to make sure I wasn’t seeing a burst of adds and then reuse after that. It didn’t fluctuate. (The evenness of the per-minute object creation rate backs this up.) Of the other 270K or so, 161K were scanned once. Even though we have creation timestamps going back to 15:00 yesterday, we haven’t seen much use of the cached results.

This view also lets us see the LRU position (LRU_NUMBER) of any object in the result cache, let’s see how spread out it is:

&amp;gt; SELECT lru_number, count(*)
FROM gv$result_cache_objects
group by lru_number
ORDER BY 2
/
...
  73968536          1
  73968524          1
  73968520          1
         0     946702

So almost every object is at the start of the LRU. This backs up the creation timestamp info above showing that they are cycling through very quickly.

At this point I went back to the docs because I don’t want to have to entirely turn off dynamic sampling, and it is not working the way I would expect (set to level 2 but acting like it’s on the new 12c AUTO). That’s when I found this text (http://docs.oracle.com/database/121/REFRN/refrn10140.htm#REFRN10140):

When this parameter is set to 11, the optimizer will use dynamic statistics to verify cardinality estimates for all SQL operators, and it will determine an internal time limit to spend verifying the estimates.

There are cases where the optimizer will automatically decide to use 11, for example:

The query will run in parallel.

The query was executed before and its history is available (from the cursor cache, Automatic Workload Repository, or the SQL Management Base).

So what this basically says is that even if you set dynamic sampling to the value you want, the Oracle optimizer *can* choose to ignore it if it has ever been run before. Given the lack of reuse of the objects in the result cache, it seems like this should not apply (probably has not seen these queries before) but this is close enough to what is happening for it to be plausible that it is ignoring my level 2 setting and using dynamic sampling. Whether that is an optimizer bug or by design remains to be seen.

The 12c doc on OPTIMIZER_DYNAMIC_SAMPLING linked over to the Oracle Database SQL Tuning Guide so I went to see what it had to say on OPTIMIZER_DYNAMIC_SAMPLING (http://docs.oracle.com/database/121/TGSQL/tgsql_astat.htm#TGSQL455). This was illuminating, missed it before when re-reading the level definitions:

13.1.3 Disabling Dynamic Statistics
In general, the best practice is not to incur the cost of dynamic statistics for queries whose compile times must be as fast as possible, for example, unrepeated OLTP queries.

… and goes on to tell you how to turn off dynamic statistics entirely: ALTER SESSION SET OPTIMIZER_DYNAMIC_SAMPLING=0;

So we don’t have a size problem. We have a revolving door LRU problem, as well as the wrong type of query being put into the result cache. Things are put in and pushed out so fast they’re never used, and additionally we are putting in dynamic sampling queries about queries with literals that will almost never be repeated. Oracle’s tuning guide basically says if you have a lot of OLTP / small queries running then turn dynamic statistics off entirely. This is unfortunate in a mixed-workload database like Peoplesoft, because our jobs can benefit from being able to sample tables on the fly. Especially with Peoplesoft where jobs are constantly deleting and reloading “temporary” (real) tables and statistics are often incorrect mid-job.

I opened an SR and worked with Oracle Support on this issue. They confirmed my tests and said that use of dynamic statistics in spite of the OPTIMIZER_DYNAMIC_SAMPLING setting is expected behavior in 12c. They pointed me to two unpublished bug fixes released in 11.2.0.4 (you can find the bug number in the release notes but there’s no info on them, 8823383 and 12914055) which enabled dynamic statistics in a number of cases. The example they gave was if the query runs in parallel and there table is sufficiently large, based on a threshold value, but that is not the only case.

When I asked for clarification on the cases that might trigger the use of dynamic statistics, the explanation was that dynamic statistics is now part of AS (Adaptic Statistics) which is comprised of Adaptive Dynamic Statistics (ADS), Automatic Reoptimization, and SQL Plan Directives, and they all interact. One example was that if an adaptive plan is used, dynamic statistics might also be used. ADS might also be triggered when Automatic Reoptimization is used. It makes sense that these other functions would want to use dynamic statistics, it is just confusing to see Oracle appear to ignore your setting.

Suggested fixes for this issue were to hint dynamic sampling off, or to turn it off entirely. Setting OPTIMIZER_DYNAMIC_SAMPLING=0 does still disable ADS entirely. You can also turn the result cache off. But there is a much more targeted solution that Oracle Support provided — you can set “_optimizer_ads_use_result_cache” = FALSE which will stop only dynamic statistics from using the result cache! That’s exactly what I was looking for.

alter system set &amp;quot;_optimizer_ads_use_result_cache&amp;quot; = FALSE;

With this issue, that amounts to a magic bullet. I’ll update as we roll it out if there are any issues, but I think at least for Peoplesoft databases and any other applications that use a lot of literals and have an at least partial OLTP workload, when upgrading to 11.2.0.4 or 12c this parameter is worth serious consideration.

Note: I did try turning on AUTO/11 for a short time under the same workload I was monitoring while researching, and it ran ADS on far more queries than with ADS set to 2. So while the optimizer is using ADS on more than you would expect with ADS set to 2, it is not the same as setting it to AUTO/11.

2015-05-27 EDIT: There’s some great back and forth in the comments that I strongly encourage you to read.  Christian Antognini, an expert in all the new or updated Adaptive features in 12c (among other things), had some significant insights into what is and is not happening with dynamic statistics.  Thanks Chris!  Here’s a summary that I wrote based on his comments (but do read through the comments):

There are dual paths by which dynamic statistics (DS) is triggered. On its own / by itself — DS behaves as expected and documented. But because of SQL Plan Directives (SPD), DS can be kicked off at any time if a SPD exists. Effectively “dynamic sampling/statistics is running more often in 12c” is a correct statement but the important part is that it is not triggered by DS, but by SPD. 12c dynamic statistics/sampling on its own does not trigger any more often than it would have in 11g for a given value of  OPTIMIZER_DYNAMIC_SAMPLING.


High log file sync with low log file parallel write / performant disk IO

Nasty one. This article sums it up quite well.  Also see this Oracle doc (also referenced in Jeremy Schneider’s blog post): Adaptive Switching Between Log Write Methods can Cause ‘log file sync’ Waits (Doc ID 1462942.1).

The Oracle doc’s list of symptoms were a perfect match for us, except we’re on 11.2.0.3.7.  Our Oracle support rep told us it is fixed in 11.2.0.4.

  • On Solaris, using Oracle 11.2.0.3.1
  • The log writer process on the database is blocking most of the other sessions and taking an average wait time of 10ms to commit.
  • On checking the hardware, the I/O wait time is very small from the hardware side
  • This means that all the time is on CPU processing the request.
  • Database is OLTP-based and has high commits/second
  • The same issue did not occur in 10g [Tyler’s note: or 11.2.0.2].
  • The problem seems to ‘go away’ temporarily after the database is restarted but ultimately returns after a few days.
  • AWR may show ‘log file sync’ waits as the highest wait

Verified issue in two databases upgraded from 11.2.0.2 to 11.2.0.3 apprx two months before the issue occurred. It can start “suddenly” as in one night during/after a large data load, log file sync jumped from 3ms to 11ms and stayed there, consistently, until we restarted the database days later. Perfect example, high log file sync, low log file parallel write, pwrites() in dtruss lined up perfectly with log file parallel writes, and no change to log file parallel write time when log file sync spiked up to its ‘new normal’. A database restart fixes it, but as this Oracle doc that the above article quotes (and our Oracle engineer gave us as well – 1462942.1) says, it comes back. The bullet points at the beginning of that doc were a 100% match for our experience. We had the Solaris kernel folks engaged as well, they were convinced it was memory fragmentation, then Oracle finally suggested this after days of round and round about non-matching ‘fixes’. Our tech said it is fixed in 11.2.0.4. The doc says 11.2.0.3.1, we’re on 11.2.0.3.7, Solaris 10.

We also found that while you occasionally see this switch back and forth in your LGWR trace file, and that does not mean you have the issue (necessarily), when it jumps up suddenly like it did for us, it’s like a switch was flipped and then it is “stuck.”  After it jumped up, it no longer switched from polling to post/wait occasionally, until we restarted the database.  Before that, it would happen once in a while.

Python 64bit, Oracle instantclient, and cx_Oracle on Mac

Since I had a considerable amount of ‘fun’ figuring this out, I thought I’d share.  I do some operational graphing (mount size over time, backup duration over time) in a bottle/mako/bootstrap/highcharts based portal, and develop locally before pushing it out with git.  Locally I use virtualenv with virtualenvwrapper (highly recommended). Connecting to Oracle from python is relatively simple using cx_Oracle, however if you’re still using the 32bit InstantClient and you’re using 64bit python, you won’t be able to use cx_Oracle.  The easy answer is to update your instantclient install to the 64bit version that came out January 2013 (huge thread by folks who were waiting for it).  There is a workaround (namely, using lipo to remove the 64bit version from the python-universal you’ll find in your virtualenv’s python binaries folder), but that way is far more painful.  Most of the info out there in various forums still tells you that using 64bit python and cx_Oracle is impossible, but with the latest instantclient that is no longer the case.

64bit client instructions:

  1. Download 11.2.0.3 64bit instantclient.  You need BASIC + sdk.  NOTE: Do not get the lite instantclient, or you won’t be able to connect to databases using certain character sets.  It will fail with a really descriptive error (not) … “cx_Oracle.DatabaseError: ORA-28547: connection to server failed, probable Oracle Net admin error.”  Sqlplus from your machine will fail the same way.
  2. Put it in a dir (as root). I put mine here:
    /usr/local/lib/instantclient64-11203
  3. Set paths:
    export ORACLE_HOME=/usr/local/lib/instantclient64-11203
    export DYLD_LIBRARY_PATH=/usr/local/lib/instantclient64-11203

    … and add $ORACLE_HOME to your path.

  4. Create these two softlinks in the instantclient dir:
    lrwxr-xr-x root ... lib -> /usr/local/lib/instantclient64-11203
    lrwxr-xr-x root ... libclntsh.dylib -> libclntsh.dylib.11.1
  5. Now you should be able to install cx_Oracle.  Make sure you’re in the correct virtualenv (if you have virtualenvwrapper, type “workon” and the name of your virtualenv).  Then check whether you’re using 32 or 64bit python right now:
    python -c 'import struct;print( 8 * struct.calcsize("P"))'

    64   <– shows we’re using 64bit python

  6. Do pip uninstall cx_Oracle first if you had installed previously when in 32bit mode … or just to be sure.  Then:
    pip install cx_Oracle
  7. Test:
    import cx_Oracle
    try:
     con = cx_Oracle.connect('username/blah@dvcadb09.capella.edu/NOTHERE')
    finally:
     try:
       con.close()
     except:
       pass
  8.  Good error (it got to the listener):
    (uops-dbas-sysportal)uops-dbas-sysportal> python test.pyTraceback (most recent call last):File "test.py", line 2, in <module>
    con = cx_Oracle.connect('username/blah@myserver/NOTHERE')
    cx_Oracle.DatabaseError: ORA-12514: TNS:listener does not currently know of service requested in connect descriptor
  9. If you plan to use tnsnames.ora make sure to also add:
    export TNS_ADMIN=/my/path/to/tnsnames.ora

If you can’t make this work, you can run everything in 32bit mode; many people have explained that process well, try this: using lipo to remove the 64bit version from the python binary.  Here’s roughly what it looks like:

(uops-dbas-sysportal)bin> python -c 'import struct;print( 8 * struct.calcsize("P"))'
64
(uops-dbas-sysportal)bin> echo $WORKON_HOME
/Users/username/.virtualenvs
(uops-dbas-sysportal)bin> pwd
/Users/username/.virtualenvs/uops-dbas-sysportal/bin
(uops-dbas-sysportal)bin> pwd
/Users/username/.virtualenvs/uops-dbas-sysportal/bin
(uops-dbas-sysportal)bin> file python
python-universal: Mach-O universal binary with 2 architectures
python-universal (for architecture x86_64):Mach-O 64-bit executable x86_64
python-universal (for architecture i386):Mach-O executable i386
(uops-dbas-sysportal)bin> cp python python-universal
(uops-dbas-sysportal)bin> lipo python-universal -thin i386 -output python
(uops-dbas-sysportal)bin> file python
python: Mach-O executable i386
(uops-dbas-sysportal)bin> python -c 'import struct;print( 8 * struct.calcsize("P"))'
32
(uops-dbas-sysportal)bin> deactivate
bin> python -c 'import struct;print( 8 * struct.calcsize("P"))'
64

HOTSOS!

So, yeah, kinda let this die for a while. Hope to post some recent work soon. Just a quick note that I’m at HOTSOS13 and looking forward to a few days of stuffing my brain! I’m on twitter as @tylervanvierzen if you happen to be there too.